Dashboard Free
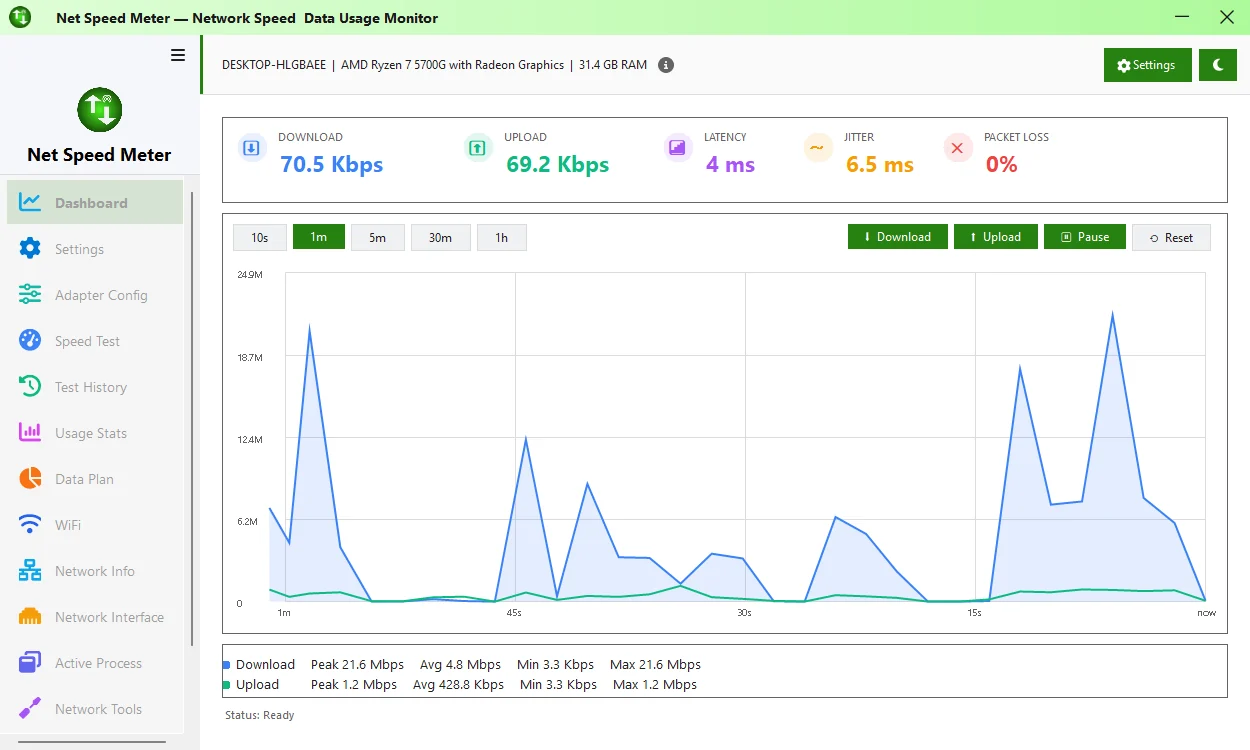
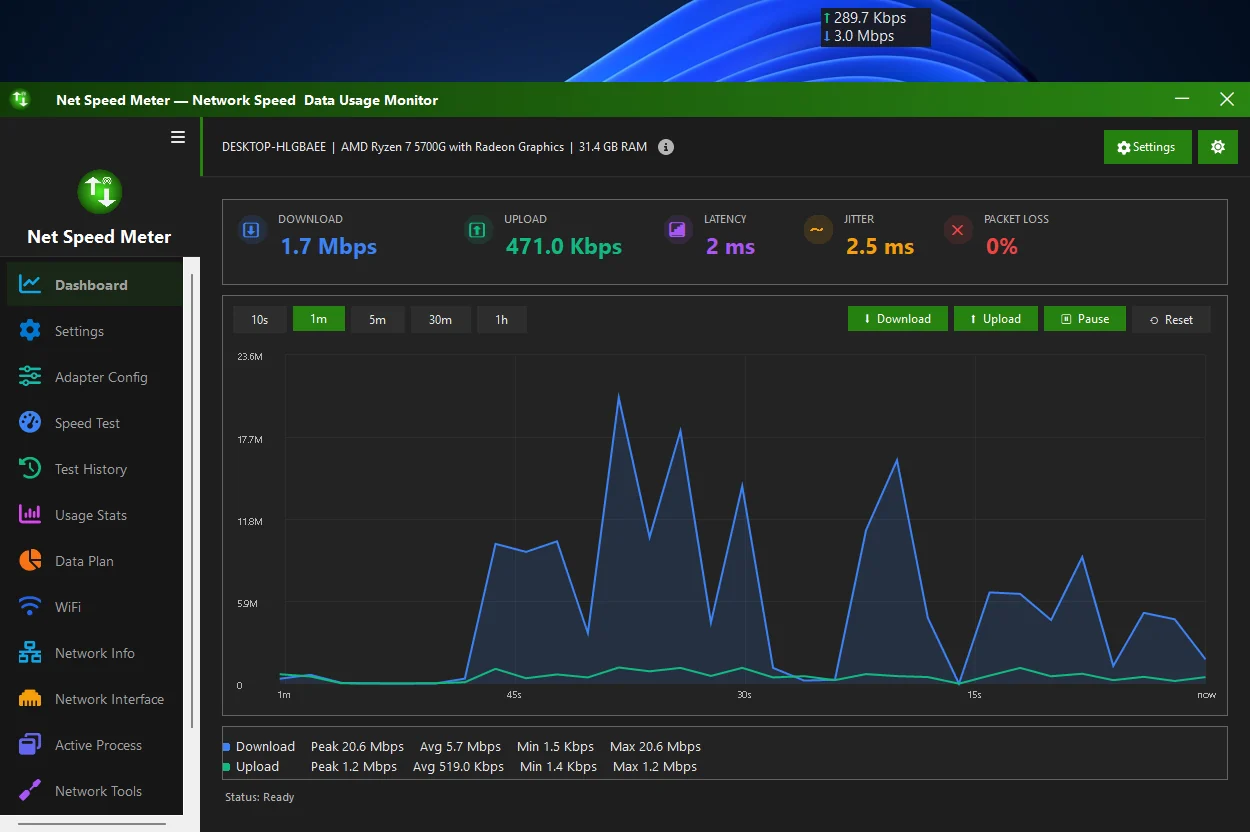
Your connection at a glance: download, upload, latency, jitter and packet loss, plus a live graph.
- Pick a time range: 10s, 1m, 5m, 30m, 1h.
- Use Download and Upload to show or hide each line.
- Pause freezes the graph. Reset clears it.
- Below the graph: peak, average, minimum and maximum speed.
The ☀/☾ button at the top right switches between the dark and light theme.